
The ability to detect crop nutrient deficiencies and promptly modify fertilizer applications to address them is invaluable to agricultural producers — especially growers operating under slim profit margins. Identifying how much of a particular nutrient to add is a balancing act. A University of Florida Institute of Food and Agricultural Sciences research project underway endeavors to remove the guesswork by providing growers with site-specific data.
UF/IFAS Best Management Practices Lab coordinator Lakesh Sharma leads a team of researchers using drones to develop algorithms that estimate nutrient application rates for optimal crop yields. They are within months of finalizing results related to the nitrogen needs of corn and cotton.
Detecting An Optimum Rate
“In the near future, growers will be able to use sensors to detect how much nitrogen is present in plant leaves and, based on our algorithms, calculate how much additional nitrogen is needed by their crops,” says Sharma, assistant professor of soil fertility and sustainable agriculture.
Establishing optimum rates for nitrogen is important because it is a mobile nutrient easily displaced by water, soil, gases and other factors. It’s also costly.
“If farmers apply too much, it cuts into their profit margins,” he says. “But they’re also mindful that if they apply less than what is needed, they could go out of business due to yield losses.”
Sharma’s study is one facet of the UF/IFAS Nutrient Management Program, a suite of state-funded research projects updating decades-old nutrient application recommendations for Florida crops. The new rates are meant to deliver crop yields of the highest quality and quantity while minimizing adverse environmental effects.
Aerial Maps With NDVI Values
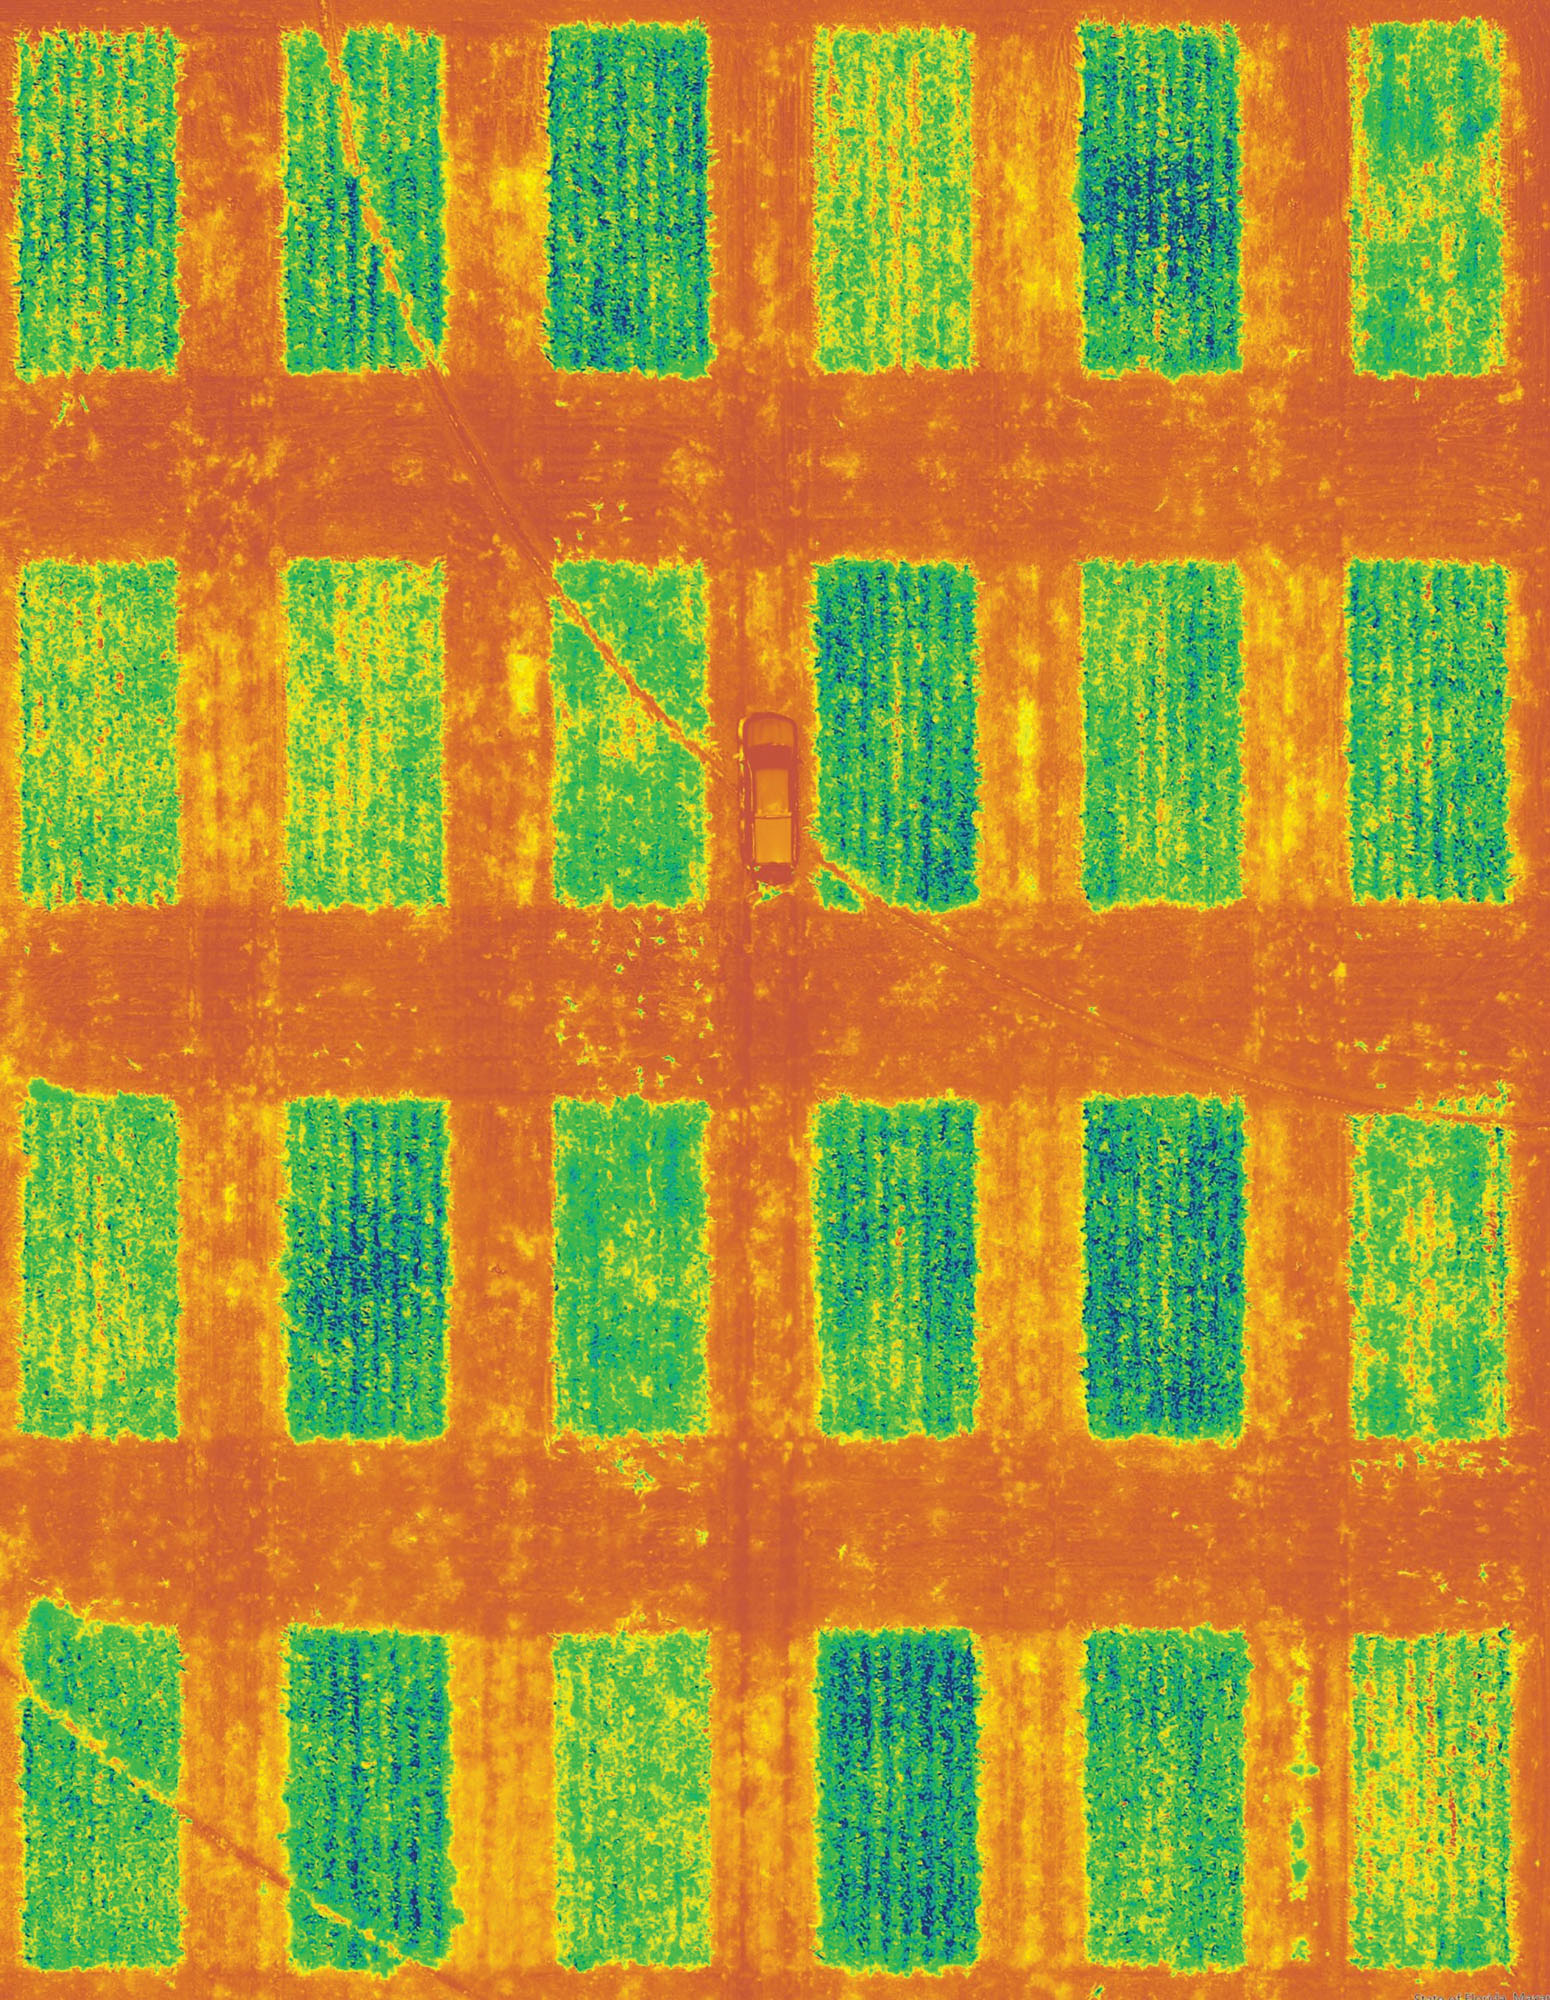
The algorithms are being developed by Sharma and his team using the Normalized Difference Vegetation Index, an established predictor of plant health. NDVI values are a ratio of the red wavelengths and near-infrared wavelengths reflected by plant leaves. For the value range: a range from -1 to 1 or low to negative values indicates water or clouds, 0 indicates bare soil and high, positive values indicates lush vegetation.
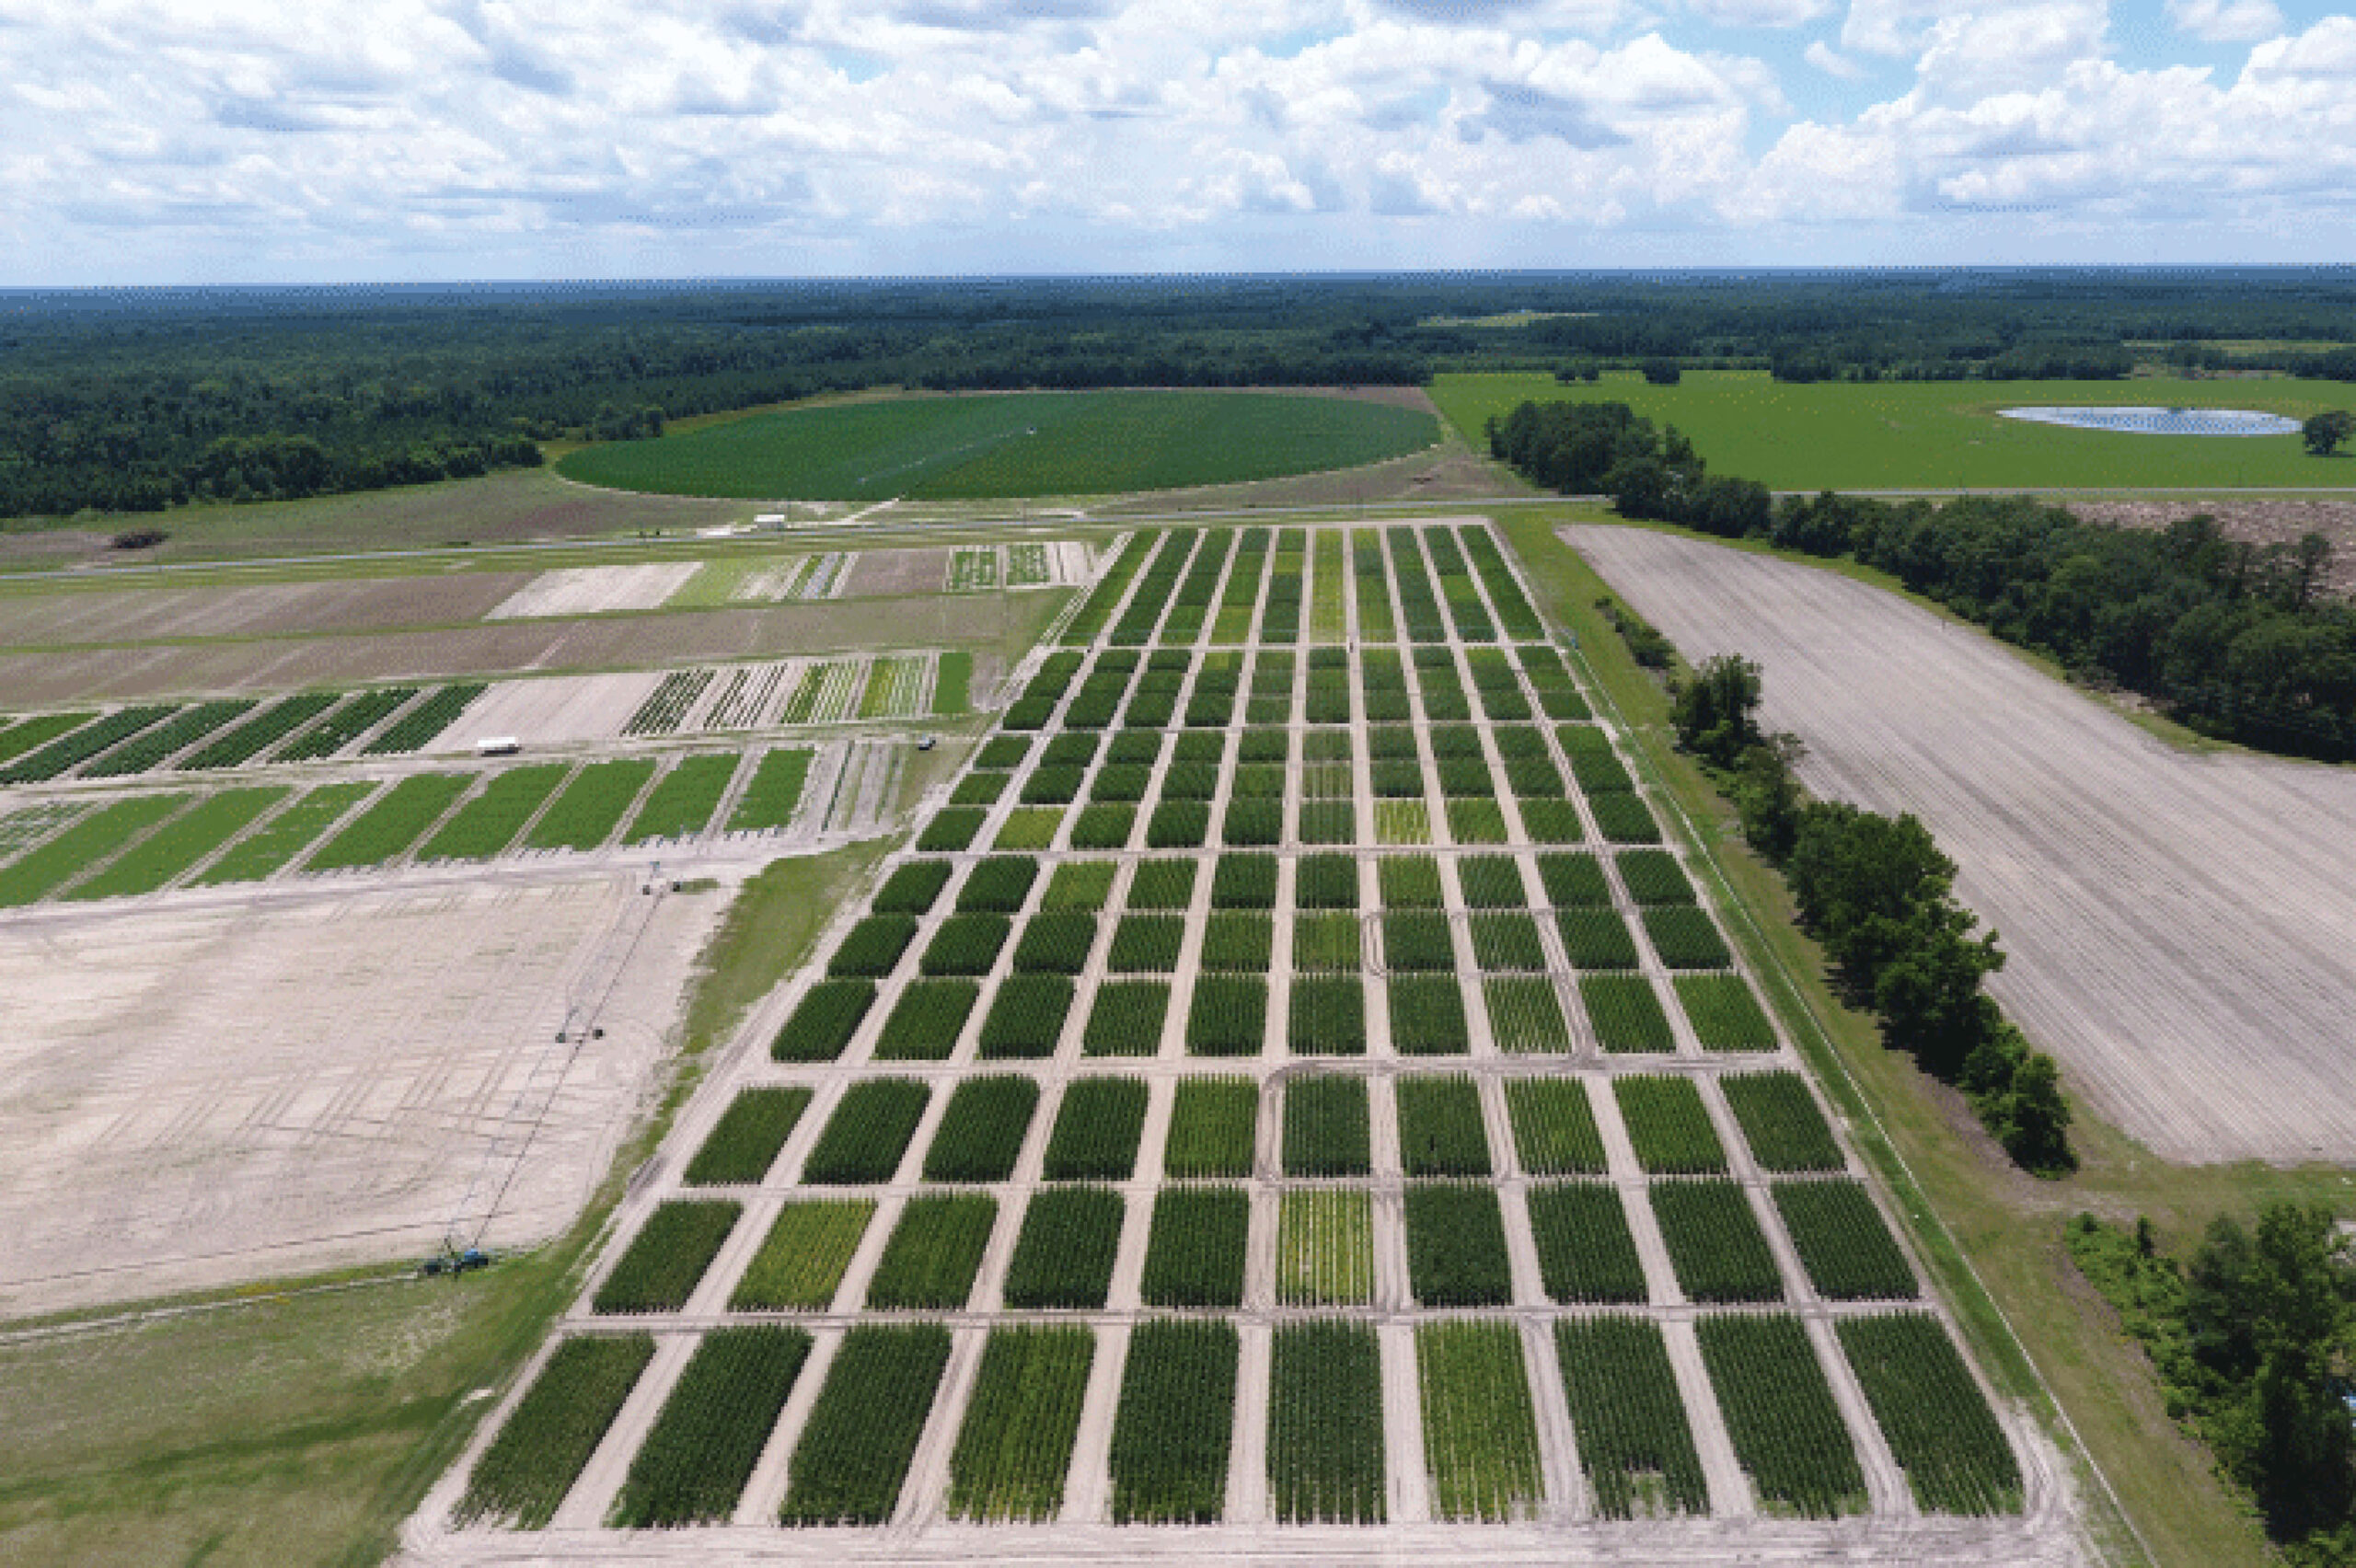
Using a multispectral sensor mounted to a hexacopter drone, Sharma’s team collected NDVI data from small plot trials at three UF/IFAS properties: the North Florida Research and Education Unit – Suwannee Valley in Live Oak; the Plant Science Research and Education Unit in Citra; and the Hastings Agricultural Extension Center in Hastings. The results are aerial maps with swaths of neon colors corresponding to NDVI values. The team’s algorithms connect a nutrient application rate with each NDVI value.
Greater Nitrogen Efficiency
By allowing the algorithms to direct nitrogen application amounts and by applying fertilizer throughout the growth cycle, Sharma’s team has achieved a nitrogen efficiency rate above 60% — about 15% higher than the national average and 20% higher than the global average.
Although the research continues, Sharma is working to share what he’s learned about precision agriculture tools like drones, NDVI sensors and NDVI-derived algorithms with growers. Through demonstrations, growers are learning how to replicate his results. He imagines a future in which they can rely on data gleaned from a sensor in the sky to direct GPS-mounted tractors applying precise amounts of fertilizer through variable-rate nozzles.
“We are making growers aware of this technology and exposing them to it as much as possible, so they can understand how it works and how they can benefit from it,” Sharma says.